Assessing the Landscape
The fundamentals of telecommunications networks are not unlike real estate in their critical reliance on location. Where network assets are located sets a baseline when considering expansion. Proximity is important. Pathways are important. And the layout and density of network targets is important. Pulling these elements together in a mapping environment can drive the answers to questions that ISPs face when considering whether to pursue public subsidies for broadband builds.
Defining RDOF eligible areas starts with the premise that eligible areas of the map are well defined and published in the form of Census Blocks that are unserved or underserved by the program definition. The same principles apply to CAF2, Reconnect, and other State and Federal programs aimed at expanding internet infrastructure and access into areas that need it most. The program provides criteria that translate into a map of areas (census blocks) that are targeted for network upgrades.
The questions around applying for subsidy funds are simple on the surface, but can become complex at the business level. At VETRO we are focused on mapping, data, and enabling users with the tools they need to draw their own conclusions. We are not offering the answers, but we hope to help you get to the answers.
PLAN
Part 1: Where to bid?
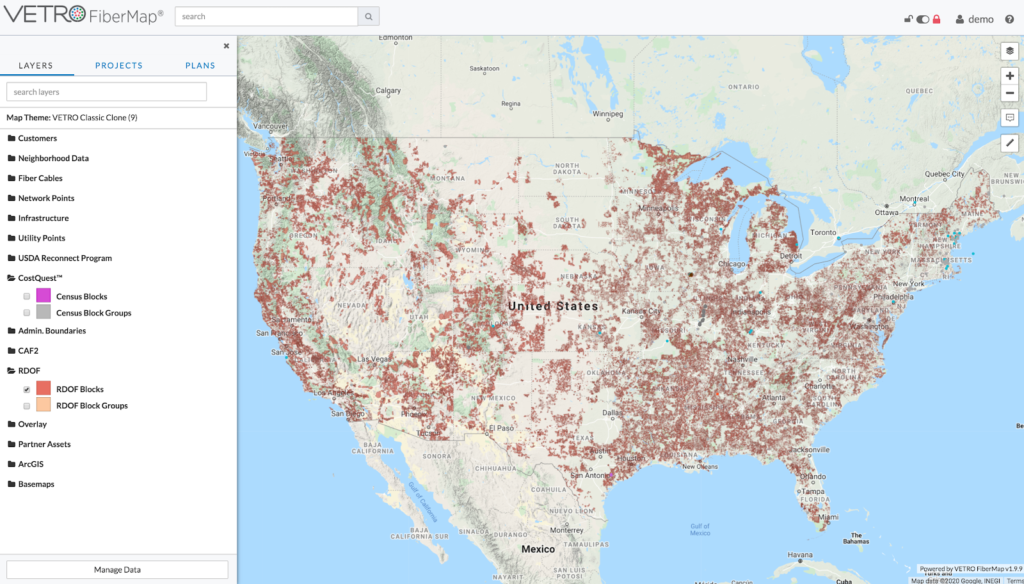
There is a map of specific Census Blocks that are eligible for RDOF funds. This map is a layer in VETRO that can be turned on to see these Block boundaries. Although this is simple, it enables the VETRO user to see where the eligible blocks are in relation to their own area of operations, and even their own current network assets. This is what we hear that many interested bidders need – a mapping environment that lets them see proximity to network and geographic relationships. Just ‘turning this layer on’ has value.
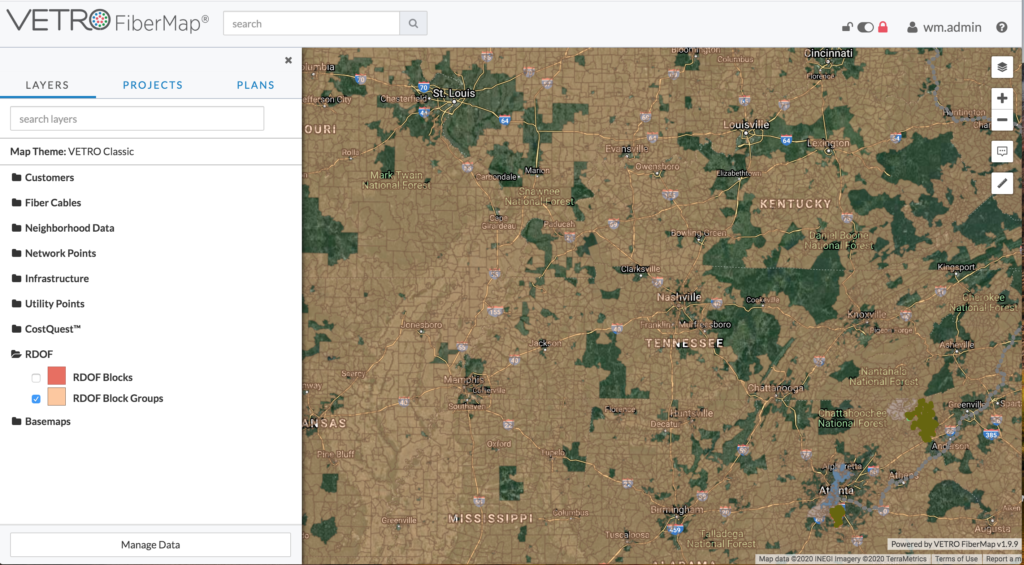
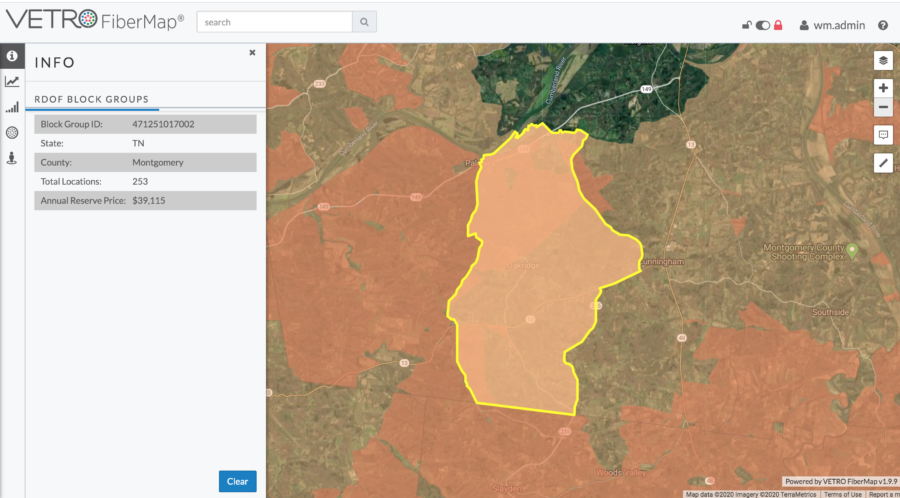
A Census Block Group that is an RDOF Auction Bidding unit is highlighted in yellow, with the Qualifying Census Blocks in darker red underneath. Note that the attribute values on the left include Total Locations and Annual Reserve Price as published by the FCC at the summary Block Group level. Location counts and annual reserve funds are not published at the Block level.

The Premises in the above map are service locations that would be expected to be served by any broadband buildout. The CostQuest Location Fabric is a unique new data resource that provides blanket address points that have been mapped to actual rooftops and filtered to relevant structures requiring internet service.

The locations in the red blocks above are RDOF eligible. The other locations outside of the red blocks are not.
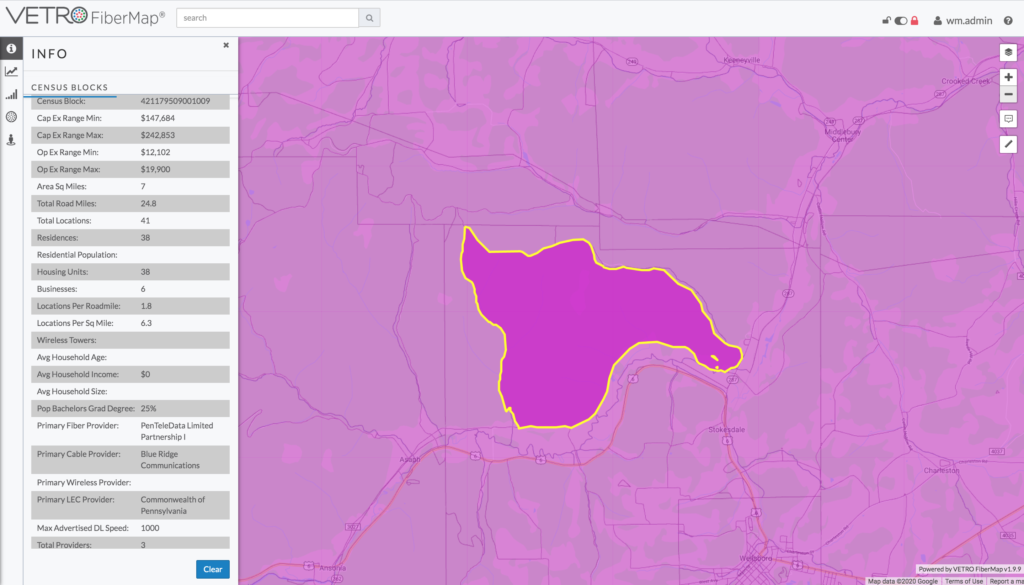
Information about broadband targets, including location counts, demographics, build costs, and competitive intelligence can be easily retrieved anywhere in the U.S. from the VETRO-CostQuest market bundle.
This information is available at a single block level via point and click. It is also possible to summarize this data into user defined or imported polygon overlays
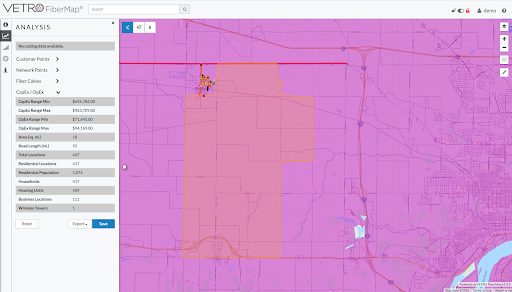
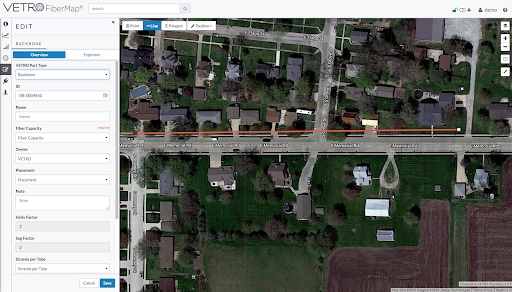
Census Blocks can be troublesome when it comes down to defining network deployments, because these blocks are intended to aggregate census data not network or engineering data. The most obvious example of this challenge is the fact that blocks are delineated by roads. This means that buildings on either side of the same street are often in different census blocks. But when doing network design, running fiber down a street is intended to serve homes on both sides.
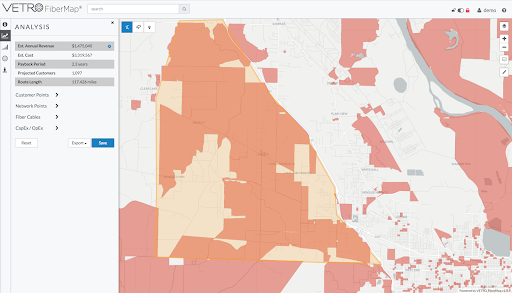
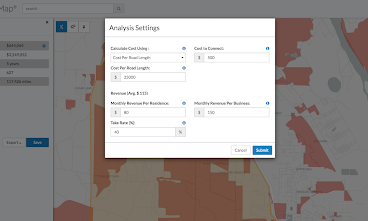
VETRO provides the flexibility to evaluate costs using the underlying geography of a road network. This frees the user from the constraints of census blocks and their artificial boundaries, and allows for micro-delineation of a build area dictated by engineering goals.
Road centerlines then serve as a proxy for fiber routes, and by assigning a cost per route mile a custom area build can be quickly estimated. Adding in an estimated take rate and applying it to location counts in the same area leads to a ‘back of the napkin’ high level view of cost and revenue – an ROI at a glance.
What we have covered above is only scratching the surface of a network build analysis. However having the RDOF funding layers blended in context with your own network mapping can lead to super fast high level screening. The next, and much more important step, is to dive into DESIGN level cost analysis, which is a core VETRO platform capability.
In a follow up blog post we will continue on this journey and go through the process of digitizing a network, assigning materials and labor costs, and getting to a project estimate using the Plan Estimation Tool (PET).
This will in turn set the stage for exploring VETRO as a network inventory platform, wherein the fiber mapping information becomes operationalized and managed. Bring on the SPLICING!
What’s next? Join Will Mitchell and CostQuest CEO James Stegeman at 12pm ET on June 9th for Visualize Success in RDOF: Part 2 – Plan, Design and Operate your Network.
If you missed part 1 on opportunity assessment, check it out on our YouTube channel. Keep an eye on our blog for more RDOF bidding tips. In the meantime, you can touch base with our team at info@vetrofibermap.com or call us at 207-221-6627. We look forward to working with you!